Self-Hosting OpenTelemetry, Part 3: Traces with Tempo and Grafana
 Yulei Chen
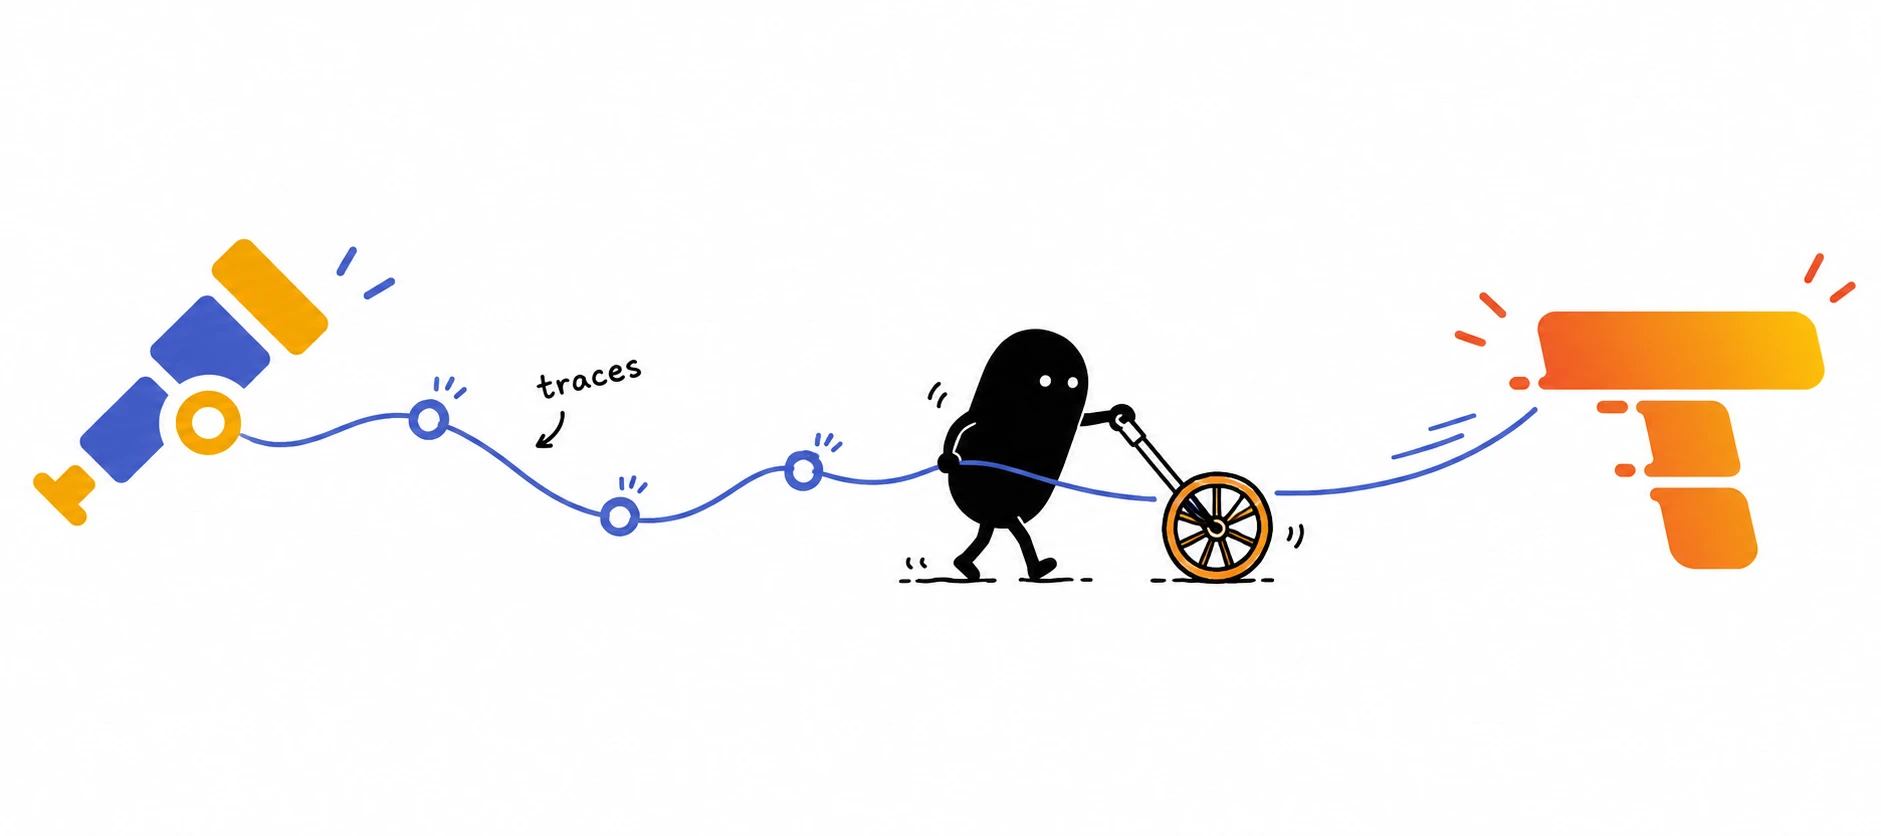
Metrics can tell you that an endpoint is slow. Logs can tell you what happened in one component. A trace connects the steps of a request and shows exactly where its time went.
In part one, we sent application metrics through an OpenTelemetry Collector to Prometheus. In part two, we added structured logs and Loki. This final part instruments the Node.js HTTP server, stores traces in Tempo, and connects log records to their traces in Grafana.
                                     +--> Prometheus (metrics)
                                     |
Node.js app -- OTLP/HTTP --> Collector +--> Loki (logs)
                                     |
                                     +--> Tempo (traces)
                                               ^
                                               |
                                            Grafana
Before you start
This tutorial builds on the repository and services from the first two parts. Keep the app, Collector, Prometheus, Loki, and Grafana on the same Sliplane server. We will add one private Tempo service.
Your repository will end up with this structure:
otel-demo/
├── app/
├── collector/
├── loki/
├── prometheus/
└── tempo/
    ├── Dockerfile
    └── tempo.yaml
1. Add tracing to the Node.js SDK
Install the OTLP trace exporter and Node.js auto-instrumentation bundle from the app directory:
npm install --save-exact \
  @opentelemetry/auto-instrumentations-node@0.80.0 \
  @opentelemetry/exporter-trace-otlp-proto@0.222.0
Replace app/instrumentation.ts with the complete three-signal setup:
import { getNodeAutoInstrumentations } from '@opentelemetry/auto-instrumentations-node';import { OTLPLogExporter } from '@opentelemetry/exporter-logs-otlp-proto';
import { OTLPMetricExporter } from '@opentelemetry/exporter-metrics-otlp-proto';
import { OTLPTraceExporter } from '@opentelemetry/exporter-trace-otlp-proto';import { defaultResource, resourceFromAttributes } from '@opentelemetry/resources';
import { BatchLogRecordProcessor } from '@opentelemetry/sdk-logs';
import { PeriodicExportingMetricReader } from '@opentelemetry/sdk-metrics';
import { NodeSDK } from '@opentelemetry/sdk-node';

const endpoint = (process.env.OTEL_EXPORTER_OTLP_ENDPOINT || 'http://localhost:4318')
  .replace(/\/$/, '');
const token = process.env.OTEL_AUTH_TOKEN;

if (!token) {
  throw new Error('OTEL_AUTH_TOKEN is required');
}

const headers = { Authorization: `Bearer ${token}` };
const resource = defaultResource().merge(resourceFromAttributes({
  'service.name': process.env.OTEL_SERVICE_NAME || 'otel-demo-api',
  'service.version': process.env.npm_package_version || '1.0.0',
  'deployment.environment.name': process.env.NODE_ENV || 'development',
}));

const metricReader = new PeriodicExportingMetricReader({
  exporter: new OTLPMetricExporter({
    url: `${endpoint}/v1/metrics`,
    headers,
  }),
  exportIntervalMillis: 5000,
});

const logProcessor = new BatchLogRecordProcessor({
  exporter: new OTLPLogExporter({
    url: `${endpoint}/v1/logs`,
    headers,
  }),
});

const traceExporter = new OTLPTraceExporter({  url: `${endpoint}/v1/traces`,  headers,});
const sdk = new NodeSDK({
  resource,
  traceExporter,  metricReaders: [metricReader],
  logRecordProcessors: [logProcessor],
  instrumentations: [getNodeAutoInstrumentations({    '@opentelemetry/instrumentation-fs': { enabled: false },  })],});

sdk.start();

process.once('SIGTERM', () => {
  sdk.shutdown()
    .then(() => process.exit(0))
    .catch((error) => {
      console.error('OpenTelemetry shutdown failed', error);
      process.exit(1);
    });
});
The HTTP instrumentation creates a server span for every request without changes to app.ts. We disable filesystem instrumentation because it tends to add noise to a small HTTP example. In a real app, configure only the library instrumentations you use.
Because instrumentation.ts is loaded with tsx --import before app.ts, it can patch Node's HTTP module before the application imports it. This ordering is essential for automatic instrumentation and follows OpenTelemetry's TypeScript setup.
2. Add a manual span around the work
Automatic instrumentation gives you the HTTP request boundary. A manual span adds a meaningful operation inside that request.
Update the imports at the top of app/app.ts:
import { type Attributes, metrics, SpanStatusCode, trace } from '@opentelemetry/api';import { logs, SeverityNumber } from '@opentelemetry/api-logs';
import { createServer } from 'node:http';

const meter = metrics.getMeter('otel-demo-api');
const tracer = trace.getTracer('otel-demo-api');const logger = logs.getLogger('otel-demo-api');
Then replace the route-handling conditional inside the request handler with:
if (url.pathname === '/health') {
  response.writeHead(200).end('ok');
} else if (url.pathname === '/work') {
  await tracer.startActiveSpan('demo.work', async (span) => {    try {      span.setAttribute('demo.operation', 'simulated-work');      await new Promise((resolve) => setTimeout(resolve, 50 + Math.random() * 250));

      if (url.searchParams.get('fail') === 'true') {
        const error = new Error('The simulated operation failed');        statusCode = 500;
        span.recordException(error);        span.setStatus({ code: SpanStatusCode.ERROR, message: error.message });      }

      response.writeHead(statusCode, { 'content-type': 'application/json' });
      response.end(JSON.stringify({ ok: statusCode === 200 }));
    } finally {      span.end();    }  });} else {
  statusCode = 404;
  response.writeHead(statusCode).end('not found');
}
Keep the metrics and logger.emit() code from part two after the route handling. Because the log record is emitted while the automatically created HTTP span is active, the logging SDK attaches the current trace and span IDs. Those IDs are what let Grafana correlate Loki logs with Tempo traces.
Use manual spans for operations that matter to your domain: charging a payment, rendering a report, or calling an internal service. Avoid creating spans around every helper function.
3. Configure Tempo
Create tempo/tempo.yaml:
stream_over_http_enabled: true

server:
  http_listen_port: 3200

distributor:
  receivers:
    otlp:
      protocols:
        grpc:
          endpoint: 0.0.0.0:4317

storage:
  trace:
    backend: local
    wal:
      path: /var/tempo/wal
    local:
      path: /var/tempo/blocks

usage_report:
  reporting_enabled: false
This is Tempo's monolithic mode with local block storage. It is easy to operate for a tutorial or a small single-node system. For a production deployment that must survive server loss or scale horizontally, use one of Tempo's supported object-storage backends.
Create tempo/Dockerfile:
FROM grafana/tempo:3.0.3

COPY tempo.yaml /etc/tempo.yaml
CMD ["-config.file=/etc/tempo.yaml"]
4. Add the trace pipeline to the Collector
Replace collector/collector-config.yaml with the complete LGTM routing configuration:
extensions:
  bearertokenauth/otlp:
    token: ${env:OTEL_AUTH_TOKEN}
  health_check:
    endpoint: 0.0.0.0:13133

receivers:
  otlp:
    protocols:
      http:
        endpoint: 0.0.0.0:4318
        auth:
          authenticator: bearertokenauth/otlp

processors:
  memory_limiter:
    check_interval: 1s
    limit_mib: 256
    spike_limit_mib: 64
  batch:
    timeout: 5s
    send_batch_size: 1024

exporters:
  otlphttp/prometheus:
    endpoint: ${env:PROMETHEUS_OTLP_ENDPOINT}
    tls:
      insecure: true
  otlphttp/loki:
    endpoint: ${env:LOKI_OTLP_ENDPOINT}
    tls:
      insecure: true
  otlp/tempo:    endpoint: ${env:TEMPO_OTLP_GRPC_ENDPOINT}    tls:      insecure: true
service:
  extensions: [bearertokenauth/otlp, health_check]
  pipelines:
    metrics:
      receivers: [otlp]
      processors: [memory_limiter, batch]
      exporters: [otlphttp/prometheus]
    logs:
      receivers: [otlp]
      processors: [memory_limiter, batch]
      exporters: [otlphttp/loki]
    traces:      receivers: [otlp]      processors: [memory_limiter, batch]      exporters: [otlp/tempo]
Commit and push the Tempo files and the app and Collector changes.
5. Deploy Tempo on Sliplane
Create another service named tempo-example from the repository. Open Advanced Settings to configure the Dockerfile path and context directory:
| Setting | Value |
|---|---|
| Service name | tempo-example |
| Dockerfile path | tempo/Dockerfile |
| Context directory | tempo |
| Server | The same server as the other services |
| Public access | Disabled |
PORT environment variable | 3200 |
| Persistent volume | Mount at /var/tempo |
Deploy the service and copy its internal hostname. We use tempo-example.internal in the remaining examples.
Tempo receives OTLP/gRPC on port 4317, while Grafana queries its HTTP API on port 3200. The service remains private; Sliplane's internal network allows both ports to be reached by services on the same server.
6. Update the Collector and app services
Add Tempo's internal endpoint to the Collector service:
TEMPO_OTLP_GRPC_ENDPOINT=tempo-example.internal:4317
Remove this environment variable from the app service:
OTEL_TRACES_EXPORTER=none
It was useful while the first two tutorials intentionally had no trace exporter, but it is no longer needed.
Redeploy the Collector, followed by the app. The app still sends every signal to one authenticated endpoint; only the Collector knows which backend receives which pipeline.
7. Query traces in Grafana
Add Tempo as a Grafana data source:
- Open Connections > Data sources.
- Add a Tempo data source.
- Set its URL to
http://tempo-example.internal:3200. - Select Save & test.
Generate test requests:
for i in {1..20}; do curl -s https://app-example.sliplane.app/work > /dev/null; done
for i in {1..5}; do curl -s https://app-example.sliplane.app/work?fail=true > /dev/null; done
Open Explore, select Tempo, switch to TraceQL, and find the service's traces:
{ resource.service.name = "otel-demo-api" }
Find only traces containing an error:
{ resource.service.name = "otel-demo-api" && status = error }
Or look for slow traces:
{ resource.service.name = "otel-demo-api" && duration > 200ms }
Open a result. You should see an HTTP server span with a nested demo.work span. Failed requests include the recorded exception and error status; successful requests show how much of the total request duration was spent in the simulated operation.
8. Link Loki logs to Tempo traces
Open your Loki data source settings in Grafana and add a derived field:
| Field | Value |
|---|---|
| Name | TraceID |
| Type | Label |
| Label | trace_id |
| Internal link | Your Tempo data source |
| URL/query value | ${__value.raw} |
Save the data source, return to Explore, and run:
{service_name="otel-demo-api"}
Expand a new log record. Grafana should show a link beside its trace ID; selecting it opens the matching trace in Tempo. If your Grafana version shows a regex field instead of a label selector, match trace[_]?id and pass the captured value to the Tempo data source.
This is the practical payoff of emitting logs inside an active OpenTelemetry context: you can start with a failed log record, open the complete request trace, and then use the metrics dashboard to see whether the problem is isolated or widespread.
Production considerations
The stack is deliberately small, but the data can grow quickly. Before treating it as production infrastructure:
- Set explicit retention and disk alerts for Prometheus, Loki, and Tempo.
- Move Loki and Tempo to object storage if losing one server would be unacceptable.
- Decide on head or tail sampling before trace volume becomes expensive.
- Redact sensitive attributes at the app or Collector before storage.
- Add Collector sending queues and persistent queue storage if telemetry must survive backend restarts.
- Monitor the Collector itself for refused, dropped, and failed exports.
- Keep image and SDK versions pinned, then test upgrades one component at a time.
Observability should not sit in the critical path of your application. A Collector or backend outage may cost you telemetry, but it should not stop the app from serving requests.
Troubleshooting
The app starts but no traces arrive
- Remove
OTEL_TRACES_EXPORTER=nonefrom the app service. - Confirm
instrumentation.tsis still loaded withtsx --importin thestartscript. - Check that the app points to the Collector's port
4318and includes the shared token. - Inspect Collector logs for errors from the
otlp/tempoexporter.
Tempo is healthy but the Collector cannot connect
Use Tempo's internal hostname and port 4317, without http://, for TEMPO_OTLP_GRPC_ENDPOINT. Confirm both services are on the same Sliplane server.
HTTP spans appear but demo.work does not
Confirm trace.getTracer() is called after the preloaded SDK has started and that span.end() remains in a finally block. Then generate new requests; previously stored traces cannot gain new spans retroactively.
Where to go next
You now have the complete local LGTM path: Prometheus for metrics, Loki for logs, Tempo for traces, and Grafana across all three. The OpenTelemetry Collector gives the application one protocol and one destination, while keeping storage-specific configuration out of the code.